Tuesday, October 19, 2010

charts / graphs / DYgraphs / Highcharts

I looked at Dygraphs earlier , seems had a .htm file on eapps host server.
It's advantage is read from CSV and plot data with out much proramming.


but see Highcharts.com good one,
1) used by fusioncharts also ( endorsement )
2) and it is ready with Ipad/iphone so better than Dygrpahs so use this one ( we need ipad we demo to many
3) it used Jquery under the hood so starndar
4) developers are still updating..
5) it has multiple axes support we need for OIL , EURO, ES and OIL price , EIA stocks etc.. to compare multiple parameters...


----------
see Ipad/iphone freelance coders under $300 ..

who am I

WHO am I ?

asr: if I think more who I am ... i think this desc works for me ..

I like to work on and think about building businesses, market positioning and product strategy. Although, by training, I'm a Software Engineer ( database , web, languages )

reference:

Sunday, October 17, 2010

Appcelerator Titanium Mobile platform,


- see this guy and his games in itunes to learn about iphone/ipad development ..

----------
http://read.weiwuhui.com/archives/664.html , it made to this list ...
------

Jolt Productivity Awards: Mobile and Web Development #2


The Appcelerator Titanium Mobile platform, a winner of this year's Jolt Productivity Award in the Mobile and Web Development category, holds two great promises to developers: First, it lets web developers, who have JavaScript and CSS skills, jump onto the mobile app bandwagon developing without learning quirky Objective-C for iOS or Java-based Android SDK. Second, it promises that apps developed in Titanium will be cross compiled into both iOS and Android native code, hence greatly reducing the need to re-write the same app for each device platform.


The technical approach it took to deliver the promises are solid. For instance, you can easily use JavaScript to build a DOM model for a table or a form, and use CSS to style each UI elements in the DOM. Titanium generates the iOS and Android code for the table or form when you build the project.

iphone economics

The median point is under 1,000. Lets call it 999. That number times $1.95 per paid app gives the 'most typical app' the total revenues in its lifetime - the full two years of App Store existence - of $1,948 dollars. This is before Apple takes its cut of 30%, so we are left with $1,363 over two years or $682 per year. This is so 'successful' that half of all of the developers of the 164,250 apps -will actually earn LESS THAN THIS. Before you start to cry, remember, there is that Angry Bird game that had 4 million paid downloads and the Bewelled 2 game with 3 million paid downloads. Thats your math there, they are totally skewing the averages, and you are stuck in the 'long tail' indeed. Half of all developers will earn less than $682 per year. Do you still think this is a good business idea?

Now we can calculate more valuable data points. The total paid apps earned $1.43 Billion over 2 years. When we divide that by the average price paid of $1.95, we get total paid app downloads of 733 million. In other words, of the total 5 Billion iPhone paid and free app downloads, 733 million - 14.7% - were paid, and obviously the rest, 85.3% of all downloaded iPhone apps were free. That is 4.27 Billion free apps. incidentially a sanity check, in Sept 2009, Yankee Group surveyed actual iPhone App users and found 18% of their apps they had were paid, 82% were free. So the math result of 15% paid apps is quite consistent with other sources.
-------------

Most of the success stories seem to be with iPhone apps. With a block buster iPhone game like "Angry Birds", which has sold over four million copies, you can do quite well even with the ubiquitous $0.99 App store pricing. As can a high quality app, especially one that fills an enterprise need, like iTeleport, a $25 iPhone/iPad app for remotely controlling Windows and Apple PCs that generates over a million dollars in annual revenues.

But those results are atypical. Tomi Ahonen crunched the numbers and calculated the the average iPhone paid app or game returns a mere $682 per year to its developer. It's worse on Android where paid apps are only available in 13 countries. Android apps tend to be offered as a free ad-supported version with a paid upgrade that removes the ads and includes an additional feature or two. Mobile web publishers generally rely on mobile advertising as well.


To make any decent amount of money with mobile advertising you need volume, a whole lot of volume. Cost per click (CPC), the average payout to the publisher when a user clicks on a mobile ad, is about 4 cents in the US. Click Through Rate (CTR) for mobile ads varies widely but most reports, including these from Mobiclix and Chitika,put it at well under 1%. Assuming that you are lucky enough to get a 1% CTR you need about a quarter of a million daily ad impressions or 7.5 million ad impressions per month to make $100 a day! And that's assuming a 100% fill rate

So at the average fill rate, you would need 37 million monthly impressions to earn $100 day. As mobile sites and apps typically only carry one or two adds per page so that equates to at least 18 million monthly page views.

Eighteen million page views is a lot. To put it in perspective, last year People Magazine reported that its mobile site averaged 19 million monthly page views, the New York Times 60 million.

Why is it so hard to make money with mobile advertising? The biggest problem is inventory. There simply aren't enough ads to go around.

Monday, October 4, 2010

CL : What Traders Should Watch this Hurricane Season


What Traders Should Watch this Hurricane Season


Bookmark and Share

This year’s hurricane season could prove to be an active one. There are some factors energy traders need to keep in mind regarding how the markets will react as any storms develop, and the differences in volatility between various products.

Hurricanes often move through the Gulf of Mexico, which contains an extensive network of infrastructure supporting the oil industry. Oil tankers need to pass through the Gulf and offload crude oil, there are offshore drilling rigs that can get knocked off their moorings, and evacuation is often required. All these factors can disrupt or limit natural gas and crude oil supplies. Traders should attempt to anticipate the progress of hurricanes to determine the direction of the energy markets, but sometimes traders don’t have all the necessary facts and the market doesn’t move as expected.

This Year’s Forecast

Typically the hurricane season starts in August and runs into late October or early November. We’ve already had one tropical storm in the Eastern Pacific, Agatha, which came remarkably early.

The National Hurricane Center recently released an extremely detailed forecast for the 2010 season. It is predicting an above-normal to extremely active hurricane season this year. There is an estimated 70 percent probability for 14-23 named storms, 8-14 hurricanes, and 3-7 major hurricanes. It doesn’t take long for a minor hurricane to move from Category 3 to Category 5 (it can happen in a day or two), so they are all important to follow if you trade the energy markets.

An accumulated cyclone energy range of 155 percent to 270 percent of the median is expected. This is a measure of the amount of force in a hurricane. By all measures, it looks like it could be a strong season, as we are also in a cycle of high hurricane activity.

The reasons for this forecast were stated as:

• The tropical multi-decadal signal, which has contributed to the ongoing high-activity era for Atlantic hurricanes that began in 1995.

• A continuation of exceptionally warm sea surface temperatures in the Main Development Region, which includes the Caribbean Sea and tropical Atlantic Ocean.

• Either ENSO-neutral or La Nina conditions, with La Nina becoming increasingly likely.


Hurricane Watching

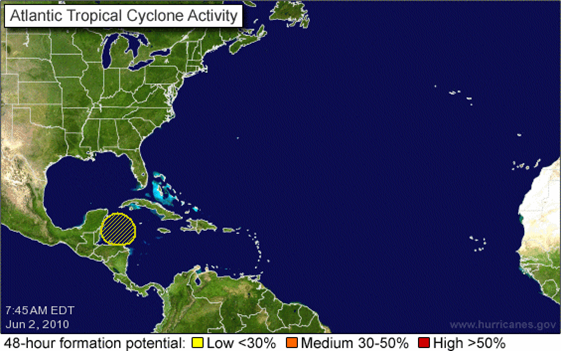
The National Oceanic and Atmospheric Administration (NOAA)’s National Hurricane Center has a map on its Web site of tropical depressions that are developing. Over time, the depressions move across the Atlantic Ocean and over the Caribbean, and often will change to tropical storms, and then to hurricanes. Often storms curve northward in a clockwise fashion. Sometimes a hurricane will move up toward Bermuda and not near the Gulf of Mexico, or move very far south in the Caribbean. The dangerous ones in terms of energy market impact are of course the ones that curve toward the key oil refining region, the Gulf.

Traders often think hurricanes develop out of nowhere, with no warning. However, tropical depressions appear about two weeks before they grow in velocity and become a big enough problem and capture the attention of the news media. Sometimes you hear of hurricanes along Pacific Coast, andT the market may spike on that information because participants aren’t paying attention to the location. Those hurricanes aren’t going to affect energy infrastructure. Before reacting to a headline of a storm or hurricane developing, look at its location and likely path and whether it will become a potential threat to oil-producing areas.

At this time, things look all clear on the NOAA map. Definitely have a look at the National Hurricane Center site. It’s an invaluable resource.

NOAA Map: www.nhc.noaa.gov

BP Oil Spill


There has been some speculation about whether the BP oil spill in the Gulf of Mexico will influence the strength or frequency of hurricanes this season. There are some theories that speculate it could change the rate of moisture entering the air from the ocean surface. However, while it might temporarily stall that energy out over the open ocean, it wouldn’t ultimately have a measurable impact as storms can quickly regain momentum. According to the NOAA, it is unlikely the oil spill will have much impact in that regard.

However, hurricanes can impact which direction the oil slick will move and how it spreads. A storm surge can cause the oil to move higher onto beaches and into the land. Oil mixed with chemical dispersants kills marsh grasses along the Gulf, it can also increase erosion. If there is a small silver lining to be found, the agitation of the water resulting from a hurricane would cause the oil to naturally biodegrade faster.
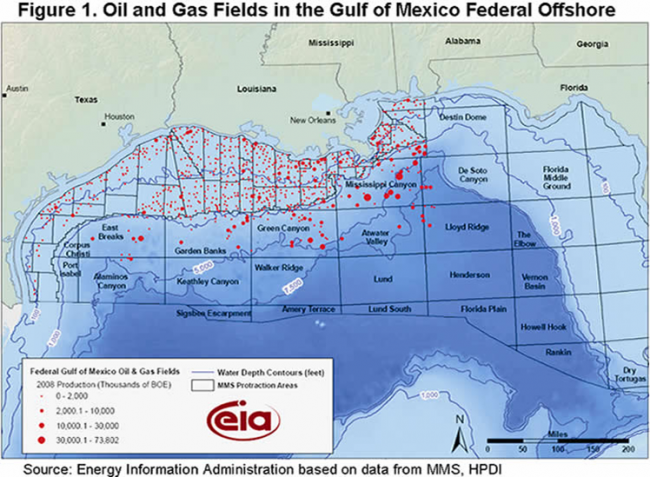
Oil and Gas Fields

The oil-producing region starts around Alabama, and runs through the southern coast of Texas. That’s the area to focus on when watching the path of a storm. The Henry Hub delivery point for NYMEX natural gas futures contracts is located in Southern Louisiana. Henry Hub took almost a direct hit from Hurricane Katrina in 2005.

Market Reaction: Natural Gas and Oil

Looking back on the 2005 season, Hurricane Katrina moved into the region on a Friday when the market was closed, and it was only a Category 3 storm moving across Florida. By Sunday night, it had been upgraded to Category 5. Natural gas gapped dramatically higher at the open Sunday evening for the trading session on Monday. Many investors who had short positions on in this market were facing large losses.

Then Hurricane Rita struck, and caused another market gap and spike higher. It didn’t prove to be a dangerous storm, but market participants were still shell-shocked from Katrina and the reaction in the October 2005 futures contract was overly dramatic. If you were trading the February 2006 contract, there was much less volatility as the market expected that even if there was storm damage, supplies would be back on line by the February delivery period.


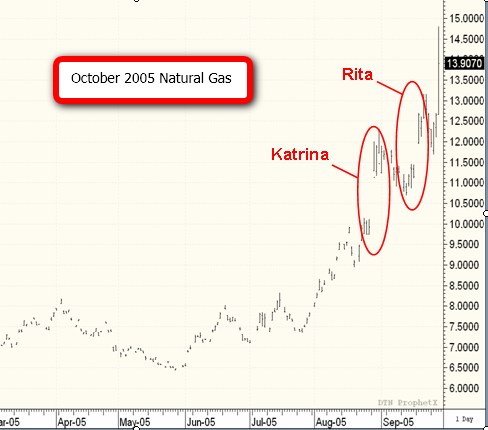
It’s important to know how the spread between various delivery months can change. If there is a delay in the movement of supplies or damage to infrastructure, it can cause a dramatic move in one month but not in another. We saw this in 2005 as the October natural gas contract spiked (which was coming up for delivery soonest) but the February 2006 contract didn’t. The spread between the two narrowed to about $0.60 per mmBtu, which is very narrow in relation to the normal spread of about $1.40. Volatility was dramatic. If you trade the spreads in this market, you need to be aware of the impact on various contract months.

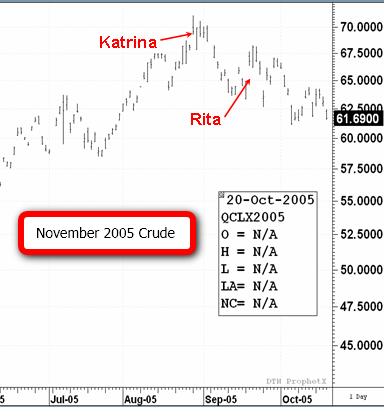
The crude oil market did not react as much as one might expect when Katrina and Rita struck. We saw spikes, but the market quickly fell off. There were two reasons for this: First, there was concern about an economic slowdown in the aftermath of Katrina that would ultimately result in lower demand. Second, crude oil is a more global commodity that is not as sensitive to local supply issues.

One storm in one region doesn’t have a dramatic impact on overall supplies in terms of the percentage of the overall global market. It is easier to replace the disrupted crude oil supply than it is to replace natural gas supply. There are shipments available from the North Sea, Venezuela, or elsewhere that can be moved via tanker.

Natural gas, on the other hand, is land-locked and difficult to move overseas. There is a North American market and a European market, and they aren’t linked. It’s expensive and impractical to move natural gas from one market to another on separate continents. Therefore, the disruption is more proportional on the natural gas side.


Trading Strategy

The natural gas futures contracts have seen a recent range of about $4.00 - $4.50. There is good support around $4.30 in the back-month October contract, and I believe purchasing contracts at $4.40 or below and trading the range is a good strategy right now. Nearing August, you might want to hold positions more aggressively and watch for tropical depressions that could result in market spikes. It is difficult to consider natural gas much below $4 during an active hurricane season.

In addition, a hot and/or dry summer is also going to fuel demand natural gas for air conditioning demand. Further, a dry summer will result in reduced hydro-electric production, which will transfer demand toward natural-gas driven electricity generation. Overall, I think the outlook for natural gas this summer is positive.

Aaron Fennell is a Senior Market Strategist based in Lind-Waldock’s Toronto office, and is serving clients in Canada. If you would like to learn more about futures trading you can contact him at 877-840-5333, or via email at afennell@lind-waldock.com.

The data and comments provided above are for information purposes only and must not be construed as an indication or guarantee of any kind of what the future performance of the concerned markets will be. While the information in this publication cannot be guaranteed, it was obtained from sources believed to be reliable. Futures and Forex trading involves a substantial risk of loss and is not suitable for all investors. Past performance is not indicative of future results. Please carefully consider your financial condition prior to making any investments. Not to be construed as solicitation.

Lind-Waldock, a division of MF Global Canada Co.

MF Global Canada Co. is a member of the Canadian Investor Protection Fund.

(c) 2010 MF Global Holdings Ltd.

Sunday, October 3, 2010

CFTC data reveal the rise of the swap dealers

SWAPS
----------

London, 26 October 2009 - John Kemp is a Reuters columnist. The views expressed are his own

New disaggregated data on traders' commitments from the Commodity Futures Trading Commission (CFTC), with back data published for the first time this week, reveal the increasing dominance of commodity indices and hedge funds in the NYMEX light sweet, oil contract

http://graphics.thomsonreuters.com/ce-insight/CFTC-DISAGGREGATED-WTI.pdf

For the first time, the disaggregated reports replace the old, discredited "commercial" and "non-commercial" categories with a new four-way classification: (a) producers, merchants, processors and users; (b) swapdealers, including index operators; (c) money managers, including trading advisers, pool operators and hedge funds; and (d) other reportable traders not included elsewhere.

The most important changes are to remove swap dealers from the old commercial category, and break out managed funds of various types from the old non-commercial category as a separate class.

The new classification is still not perfect. The Commission continues to allocate all positions held by a trader to a single category (e.g. producer or swap dealer) even when they are held for a variety of purposes (some as hedges, others as speculative positions as part of the proprietary trading book) based on its assessment of the trader's "predominant activity". Nonetheless, the disaggregated data marks a huge improvement, and provides a much more nuanced insight into the market, especially the scale of the index funds and hedge funds.

While the Commission began releasing disaggregated data at the start of September, this is the first time it has published position data on the same basis all the way back to June 2006, covering the years leading up to the vertiginous spike in crude oil prices during H1 2008. Conspiracy theorists who want to blame the spike on the work of "speculators" will be disappointed. There is no "smoking gun" in the back data. But it does confirm the spectacular rise of the swap dealers and other financial participants, and why both the forward curve and price behaviour have altered profoundly in the last five years.

Rise of the Swap Dealers

Swap dealers (a category that includes investment banks using futures and options to hedge OTC deals and commodity index positions they have sold) have more than doubled their (gross) positions from 640,000 contracts (equivalent to 640 million barrels of physical oil) to 1.4 million contracts (equivalent to 1.4 billion barrels).

Swap dealers now account for more than one in every three futures and ( delta-adjusted) options positions on NYMEX (37 percent), up from 28 percent three years ago. Swap dealers have become indispensible providers of liquidity, essential to market functioning.

In fact, the CFTC data on swap dealers' positions understates their importance because it only shows their onexchange futures and options positions. As the Form Y-9C data on Goldman Sachs' and Morgan Stanley's trading books revealed, on-exchange positions were only a small part of their overall trading books at the end of Q2. Off-exchange forward contracts, OTC options and swap positions were much larger and only a portion of that was hedged out onto the exchanges.

Most of the growth in swap dealers' positions has come in the form of increased exposure to time spreads rather than outright longs or shorts. Spread positions have risen more than 1.5 times from 395,000 contracts to 1.051 million contracts, while combined long and short positions have remained broadly unchanged at about a third of this amount (300-400,000 contracts).

Spreads are most closely associated with the growth of commodity indices, exchange-traded funds and other investment strategies, rather than hedging, so the explosive growth in this category is some indication of how rapidly the sector has grown.

The sheer weight of spread positions helps explain why the traditional forward price structure in commodity markets has broken down, with the emergence of large and persistent contangoes in the markets for crude oil and products, 0devastating returns for long-only index investors.

http://graphics.thomsonreuters.com/ce-insight/CHANGING-FORWARD-STRUCTURE.pdf

Financial Players Dominate

By shifting the swap dealers' positions from the old commercial category to the old non-commercial one, then breaking them out, the disaggregated data has revealed just how far the market has become dominated by financial players rather than producers and consumers.

The scale and impact of swap dealers' positions is difficult to exaggerate. Swap dealers now account for many more positions (1.4 million contracts) than "traditional" market users such as producers, users, merchants and processors (822,000 contracts). If we include managed-money funds (604,000 contracts) and other reportable positions (698,000 contracts), then financial players' combined positions (2.7 million contracts) outnumber traditional market users by a ratio of 3:1.

In the traditional characterisation of a commodity futures market, most activity was linked to producer and consumer hedging, with a relatively small amount of speculative activity at the margin to provide liquidity and cover any imbalance between the amount producers wanted to sell forward and consumers wanted to buy.

In developing his theory of "normal backwardation", John Maynard Keynes assumed hedgers (who he thought would be predominantly producers wanting to hold a short position against future sales) would have to pay a "risk premium" to investors (who would have to be mostly long) to give them an incentive to take the price risk. The existence of this premium is crucial to long-run returns on long-only commodity indices.

But this characterisation no longer describes how the market works. It is producer and consumer hedging that now accounts for the marginal impact on the market, and financial positions which dominate. The idea that most positions involve producers and consumers, with speculators simply covering the remaining, narrow gap is not accurate.

Expectations or Fundamentals

Rather than being driven by actual, near-term changes in supply, demand and inventories ("physical fundamentals"), the price of oil and other commodities is increasingly being driven by investors' expectations about changes in availability and prices in the very far future, often over horizons of 5-10 years or more.

During the sharp run up in oil prices in H1 2008, and then again in H2 2009, analysts have been forced to cite the "forward-looking" component of prices and the risk of shortages far in the future to explain why the market rose strongly against a backdrop of ample supplies, insisting it was reflecting fears of shortages far in the future (1-4 years) rather than the present.

Most analysts are reluctant to ditch fundamental analysis in favour of an expectations based approach that treats commodity futures as a financial asset like equities or bonds. But the "financialisation" of commodity markets is increasingly embedded in both forecasts and market behaviour.

With financial players providing 75 percent of the interest, and almost all the liquidity, commodity futures markets are increasingly delinked from the underlying physical, trading more in line with macroeconomic and strategic influences alongside currencies, equities and bonds.

Ends –

-------------------

Oil and Gas Hedging: How will it change

Congressional representatives and White House officials have reached agreement on the details of a new law that will impact our nation’s financial system

JUNE 28, 2010

http://www.mercatusenergy.com/blog/bid/42728/Energy-Hedging-in-a-Reformed-Environment/


http://www.tklaw.com/resources/documents/TK%20Client%20Alert%20-%20Oil%20and%20Gas%20Hedging%20-%20How%20Will%20It%20Change.pdf


"Oil and Gas Hedging: How will it change?". In summary, their opinion, as we interpret it, is that oil and gas producers should still be able to engage in hedging "as usual" with a few, potential changes:

  • Banks will most likely be forced to conduct commodity, including oil and gas, trading through affiliated entities rather than the bank itself.
  • Interest rate and foreign exchange hedges will most likely receive an exemption from the bill and as such, banks will continue to be able to trade OTC interest rate and foreign exchange derivatives as they do today. One unintended consequence of this framework is that producers will, most likely, no longer have the ability to net their commodity, interest rate and FX positions.
  • New and/or additional ISDAs will be required.
  • Oil & gas producers will probably retain the ability to utilize assets as collateral for hedging.
  • Hedging "costs" will increase as bank affiliated commodity trading entities will be required to maintain higher capital levels. In addition, these new entities may be required to clear their trades, which means they will need to post cash collateral, the cost of which will be passed on to their customers.

If you're interested in reading the full version of the "alert" it is available on the Thompson & Knight website.

On Tuesday, Alistair Barr at Marketwatch.com, authored an article titled, "Derivatives group sees $1 trillion regulatory impact." Among other things, the article states:

The International Swaps and Derivatives Association said Tuesday that the bill could lead to a requirement to post collateral for all over-the-counter derivatives that are not cleared, including those involving an end-user.


why are oil prices so high? SEPT 2004


This is SEPT 2004 article
Why are oil prices so high?
Oil refinery in Colombia
No sign yet of oil prices dropping back to earth
Crude oil prices have risen by about 30% this year to levels not seen since the early 1980s.

The latest rises are causing worries in importing countries about the economic cost of higher energy prices.

Higher fuel prices can cause unwelcome rises in inflation, restrict economic growth and are unpopular with voters.

Major oil exporters are divided between those such as Saudi Arabia and Kuwait that favour lifting output in an attempt to ease prices, and those such as Venezuela that argue against conciliatory moves towards big consumers, principally the US.

The price of US-traded light, sweet crude rose in September to more than $50 a barrel while UK-traded Brent crude from the North Sea rose to $46 a barrel.

BBC News Online explains why prices are so high.

RISING DEMAND

Global economic expansion is driving what the International Energy Agency says is the biggest increase in oil demand for 24 years.

There is higher than expected demand in industrialised countries and China's rapidly expanding economy has created a huge demand boost.

US demand has risen because of strengthening economic recovery and greater need for higher grade crude oil suitable for processing into petrol (gasoline) for the fuel-hungry Sport Utility Vehicles (SUVs) popular with US drivers.

Chinese demand is up 20% over the past year. Traders are betting this rapid growth will continue for several years although there is some chance that the economy will "overheat" and oil demand growth will slacken.

Among suppliers only Saudi Arabia has significant spare capacity that it can make available to the market.

LOW STOCKS

Oil companies have tried to become more efficient in recent years and operate with lower stocks of crude oil.

This means there is less of a cushion in the market against supply interruptions.

Events such as violence in the Middle East, ethnic tension in Nigeria and strikes in Venezuela have had a greater effect on prices in the past year than might have been the case if stock levels were higher.

OPEC STRATEGY

The producers' cartel Opec accounts for about half of the world's crude oil exports and attempts to keep prices roughly where it wants them by trimming or lifting supplies to the market.

In the past, Opec ministers tended to wait for prices to dip before agreeing to cut output.

Chinese construction workers
China's booming economy is sucking in a huge amount of oil
But Opec is now acting more aggressively, announcing production cuts to pre-empt any weakening in prices.

International oil companies traditionally used times of seasonally weaker demand, when prices were lower, to rebuild stocks.

These windows now appear to have been closed.

Data error is an additional factor, some analysts say.

Consumption forecasts by market experts turned out to be too low. The result was that producers kept supplies even tighter than was needed to prevent rebuilding of stocks.

ACTION OF SPECULATORS

The combination of low stocks and Opec action to keep them low leaves the market exposed to the prospect of sudden price rises if supplies are threatened.

This has not gone unnoticed by professional market speculators.

Hedge funds and other speculators betting on the possibility of higher prices have themselves exacerbated price pressure in the market.

Opec officials tend to blame speculators for 2004's run-up in prices, ignoring the organisation's earlier role in preventing stock rebuilding.

Opec argues that its members are now pumping flat-out - which is largely true - and that it is powerless in a situation where factors other than mere supply and demand are at work.

VIOLENCE IN THE MIDDLE EAST

The world's major oil consumers remain dependent on the Middle East for their oil. Recent violence in Iraq and Saudi Arabia has again raised fears about an interruption to supplies.

Iraqi exports have been cut by sabotage attacks on oil facilities. The reduction in supplies has been relatively modest but it has caused some doubts about Iraq's longer term prospects of becoming a large and stable oil exporter.

Attacks on foreign workers in Saudi Arabia by Al-Qaeda-inspired militants have also increased tensions.

Any substantial attack on Saudi oil facilities would be a major event for world oil markets. The country is the world's biggest oil producer and, by far, the biggest exporter.

OTHER POLITICAL TENSION

Analysts also view political tension in non-Middle East states Nigeria and Venezuela as having the potential to disrupt exports and drive up world prices.

And there have been worries that a dispute between Russia's government and the country's biggest oil company, Yukos, will lead to the shutdown of a good deal of Russia's production.

Yukos pumps a fifth of Russia's approximate 8.5 million barrel a day output but faces bankruptcy and/or dismantling over huge government demands for back-taxes.

INSUFFICIENT US REFINERY CAPACITY

Low US gasoline stocks and pressure on US refiners to increase production of new gasoline blends have also helped drive world crude oil prices.

Environmental regulations demand new grades of gasoline, which can vary from state to state.

But building processing facilities to serve so many different markets is expensive and environmental concerns can make planning permission difficult to obtain.

This means refiners are struggling to meet demand and are competing with each other, and with China, to secure supplies of the high quality, light, sweet crude needed for new gasoline blends.

Saudi Arabia's previously spare capacity, now being pushed into the market, is mostly of a heavier grade than is suitable for processing into gasoline.

It will not alter the supply-demand situation for high grade crude oil. At best, it will have a limited psychological impact, sending a message that the world's largest oil exporter will do what it can to cool prices.

Friday, October 1, 2010

CL trading analyst /

1) quant trader ( developer) and 'energy market analyst' are different

this is commodity analyst post ( energy markets ) , this is what I am most suited not as Quant which needs lots of math but no oil fundamentals. my strength is oil funamentals, contract month high/low cycles , back/front month spread at expiration , long 1 year ahead DEC sperads

CL spreads in 2005


The Price of Crude Futures as of August 18th, 2005

Delivery Date - Price
    Sep '05 - $63.25
    Oct '05 - $63.85
    Dec '05 - $64.88
    Sep '06 - $64.42 - wow diff between sept 05 and sept 06 is 15 cents for the current month CL contract ,
    asr: I think reason being CL moved from $30 range for 5 years from 2000-2005 to new $50 first time in 2005, so oil producers who are used to $30 oil for a decade love to take $55 for next 5 to 6 years and same CL speculators are can not digetst 60 oil for next 5 years. this explains the no spread on CL for multiple years, so spread seems started from 2006 onwards with higher oil prices of range 60 to 70
    Dec '06 - $63.88
    Dec '07 - $61.39 - and you have backwardness for 06/07 ..
    Dec '08 - $59.74
    Dec '09 - $58.64
    Dec '10 - $57.94
    Dec '11 - $57.64
As you can see, oil futures do not predict $80 barrels of oil in 2006. They seem to predict that oil prices will rise, but only by a dollar or two. Why the discrepancy? I can think of a few reasons why futures contracts may be lower than predicted oil prices, such as:
  1. The time value of money: By buying a futures contract, you're tying up money today for a good to be delivered months or years from now. If I wanted oil in September 2006 I could either buy a future contract today, or take the money, invest it in a stock or bond, then sell that asset in 2006 to pay for the oil I need. Futures prices tend to reflect this, which is why the future price for oil in 2011 is so low. But can the time value of money really be so high that people are willing to pay $80 for a barrel of oil next year when they can "lock in" at $64.42 right now?

  2. Liquidity: Futures contracts for far off dates such as December 2011 tend to be very illiquid - there are not too many buyers or sellers. That is not the case for contracts in 2006, as they are traded multiple times a day.

  3. Future Prices as a Mean: Perhaps many people believe that a barrel of oil will be $80 or $100 next year and are buying contracts based on that belief. If there are investors who believe that oil prices will crash and expect $30 barrels next year, then they would be acting to drive the futures price down to the current level. To get a better idea if this is happening, we would need to consider the price of crude oil options, not just futures.

  4. Entry Costs: The minimum crude oil contract that one can buy or sell on the NYMEX is in the range of $33,000. This may deter many investors from entering the market, leaving the price artifically low.
Can these factors be causing the price of crude oil futures to be artificially low? It wouldn't seem so given the magnitude of the spread between futures prices and pundit expectations. So either:
  1. The pundits are wrong

  2. The markets are wrong and investors are leaving a lot of money on the table by not buying up crude oil futures
I'm not sure which to believe. The second explanation seems pretty unlikely, but then again, crude oil futures did not anticipate the recent rise in price. My gut still tells me that the first explanation is the correct one, but I'm not as confident in it as I would like to be.

I'd love to hear what you think on the matter. You can contact me by using the feedback form.